The Market View Data Files
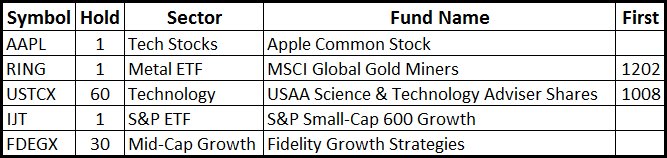
Symbols.xlsx
Each market symbol that you want to follow is listed with the amount of
time that you must hold the investment before paying zero transaction
fees. The market sector and the name of the fund, stock, or ETF is also
listed. If the symbol has been listed on the stock exchange for less
than 10 years, the YYMM date of its initial listing is also given.
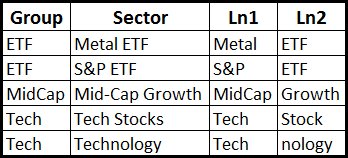
Sectors.xlsx
The Market View process tracks your investments by symbol, sector, and
also a custom sector grouping that you personally design. The Ln1 and
Ln2 entries are provided so the sector names can be listed on the
Historical View page within the width limits of a normal stock
symbol.
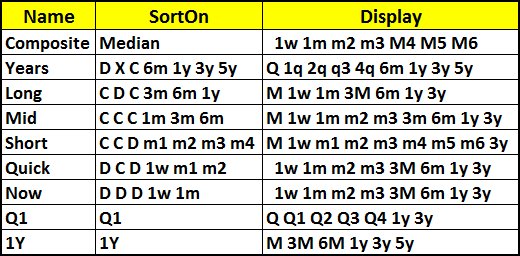
PageDesigns.xlsx
The entire concept of the Market View process is to allow you to look
at the market from a wide variety of viewpoints, and you get to design
each page. The first 3 page designs are for your Short, Median, and Long
Composite views. The display column lets you define which ROR time
frames will display on each view. Each Custom view Sort On entry starts
with 3 letters. Will the rank of this Custom View C count, D just display,
or X not even display, for the ranking of the Short, Median, and Long
Composite view.
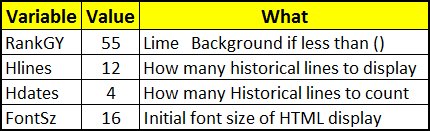
Settings.xlsx
These are the initial settings for 16 different variables. The break points
for the background colors when displaying the calculated Ranks, what page to
display first, how many historical lines to display, how many count for the
overall historical rank, what font size to use, etc.
| Symbol | Action | Amount | month | day | year |
|---|
| SDOG | Buy | 9620.95 | 4 | 1 | 2017 |
| SDOG | Value | 10066.08 | 4 | 30 | 2017 |
| SDOG | Value | 9966.98 | 5 | 31 | 2017 |
| SDOG | Sell50 | 5204.13 | 6 | 19 | 2017 |
| SDOG | Value | 4866.37 | 6 | 30 | 2017 |
| SDOG | Sell | 4972.45 | 7 | 5 | 2017 |
History.xlsx
An accurate log of your investment history is crucial to the
determination of when
and how to keep your investment in proper balance.
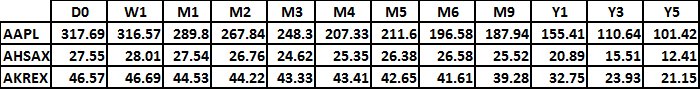
The history file contains blocks of data for the Value of each
of my investment at the end of each month, plus the additional data on
what did I Buy or Sell# each month. The sell lines include a number
representing the percentage of my total holding that I sold. If there
is no number, I sold my entire holdings in that symbol.
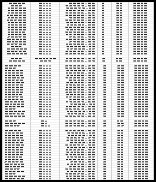
SnapShot.exe: Gets the data for the RawDataYYYYMMDD.txt files.
This process takes a snap shot of the market on any given date. It uses Yahoo
Finance to obtain a series of 12 historical adjusted closing prices based on
the requested SnapShot date. The historical prices for each symbol in the
symbols file are then saved in a file called SnapShotYYYYMMDD.txt; along with
the closing prices for the four major market indexes: Dow, Nasdaq, Russell,
and S&P.
A snapshot usually takes about 1.4 seconds per symbol based on your Internet
speed. This can be done daily so you can always see the latest
data, and monthly or quarterly to give you a historical perspective on the
market.
- SnapShot: Takes a snapshot of the last day of the previous
month.
- SnapShot now: Takes a snapshotX of today�s prices and deletes all
previous �X� snapshots.
- SnapShot 5 2016: Will take a historic snapshot of the last day of
that month.
- SnapShot 5 18 2016: Takes a snapshotX on the requested date
and deletes all previous �X� snapshots.
- SnapShot drop VWXYZ: Marks VWXYZ in every snapshot file to be
ignored by the display software.
- SnapShot add VWXYZ : Un-marks VWXYZ in every snapshot file or adds
it if it does not already exist.
The File System
The data files are maintained in a series of Excel Spreadsheets, but
the Market View process uses .tdt, tab deliminated text, files. The .xlsx
files are in a parallel ExcelData directory that includes a series of
DOS BATch files that will convert all of the Excel files or each
individual Excel file into the required TDT file format.
@echo off
call ToTDT History
call ToTDT PageDesigns
call ToTDT Sectors
call ToTDT Settings
call ToTDT Symbols
The actual conversion from Excel to tab delaminated is performed by a
visual basic program. ToTDT is another DOS BATch file that converts
each filename into the proper calling sequence for the visual basic
program.
pushd ..
set parent=%CD%
popd
cscript script.vbs "%CD%\%1.xlsx" "%parent%\%1.tdt"
Call ToTDT History
becomes
cscript script.vbs
"C:\MarketView\Data\ExcelFiles\History.xlsx"
"C:\MarketView\Data\History.tdt"
The System cscript.exe file is also required to be in the ExcelFiles
directory to run this visual basic program:
Set objArgs = WScript.Arguments
InputFile = objArgs(0)
OutputFile = objArgs(1)
Set objExcel = CreateObject("Excel.application")
objExcel.application.visible=false
objExcel.application.displayalerts=false
set objExcelBook = objExcel.Workbooks.Open(InputFile)
objExcelBook.SaveAs OutputFile, -4158
objExcel.Application.Quit
objExcel.Quit
The -4158 at the end of the SaveAs line is just one of those Geeky
numbers that tells Excel that the output format is tab delimited!
Other Stuff
NewPageDesigns.tdt
| Type | Name | CDX | Sort On |
Display |
|---|
| Composite | Median | | | |
| | |
| # | T | | | | V | R |
1w | 1m | 3m | 6m | 1y | | |
| | N |
| Composite | Short | | | |
| | |
| # | T | | | | V | R |
1w | 1m | m2 | m3 | m4 | 6m | |
| | N |
| Composite | Long | | | |
| | | | # | T |
| | | V | R | 1q | 2q | q3 | 4q |
6m | 1y | 3y | | | N |
| View | Years | D | X | C | 6m |
1y | 3y | | # | T | H | I |
S | Q | R | 1q | 2q | q3 | 4q |
6m | 1y | 3y | | | N |
| View | Long | C | D | C |
3m | 6m | 1y | | # | T | H | I |
S | M | R | 1w | 3m | 6m |
1y | 3y | | | | | N |
| View | Mid | C | C |
C | 1m | 3m | 6m | | # |
T | H | I | S | M | R | 1w | 1m | 3m |
6m | 1y | 3y | | | | N |
| View | Short | C | C |
D | m1 | m2 |
m3 | m4 | # | T | H | I | S |
M | R | 1w | m1 | m2 | m3 |
m4 | m5 | m6 | 3y | | N |
| View | Quick | D | C | D | 1w |
m1 | m2 | | # | T | H | I | S |
| R | 1w | 1m | m2 | m3 |
3m | 6m | 1y | 3y | | N |
| View | Now | D | D | D | 1w | 1m |
| | # | T | H | I |
S | | R | 1w | 1m | m2 | m3 |
3m | 6m | 1y | 3y | | N |
| ROR | 3M | | | | 3M | |
| | # | T | H | I | S |
M | 1w | 1m | 3m |
6m | 1y | | | | | | N |
| ROR | 6M | | | | 6M | |
| | # | T | H |
I | S | M | 1w | 1m | 3m | 6m |
1y | | | | | | N |
| ROR | 1Y | | | | 1Y | |
| | # | T | H |
I | S | M | 3m | 6m | 1y | 3y |
| | | | | | N |
- Type: Is this page sorted on a single ROR, or a custom
View sorted on multiple RORs, or a Composite view sorted
on multiple custom views. CDX will explain how the composite views are
sorted.
- Name: This is the name that will be displayed in your dropdown
list.
- CDX: There are up to 3 Composite views. The letters in these
fields indicate if this custom view is 'C'ounted in the sort of
each composite page, only 'D'isplayed on the page but not counted
for the sort, or 'X' not even displayed on the composite page.
- Sort On: Up to 4 individual RORs that can be used to sort each
custom view page.
- Display: The columns that are displayed on each page.
- #: The calculated Rank of this row.
- T: The ticker symbol of this row.
- H: The No Transaction Fee holding period of this
symbol.
- I: How much of your portfolio is invested in the symbol and
how long you still have to hold it for No Transaction Fee.
- S: The market sector of this holding.
- Q: A graph of the last 4 quarterly returns for this symbol
and a graph of how those returns compared to the market average.
- M: A graph of the last 6 monthly returns for this symbol
and a graph of how those returns compared to the market average.
- V: Display the custom view rankings as defined by the CDX
entried of each custom view.
- R: The sum of the ranks used to define the individual
ranks for this page.
- N: The name of the fund represented by this symbol.
A quick Summary of the
Market View process
|