Custom Views of the Market
- The MarketView software also allows for the creation of Custom
Views of the market.
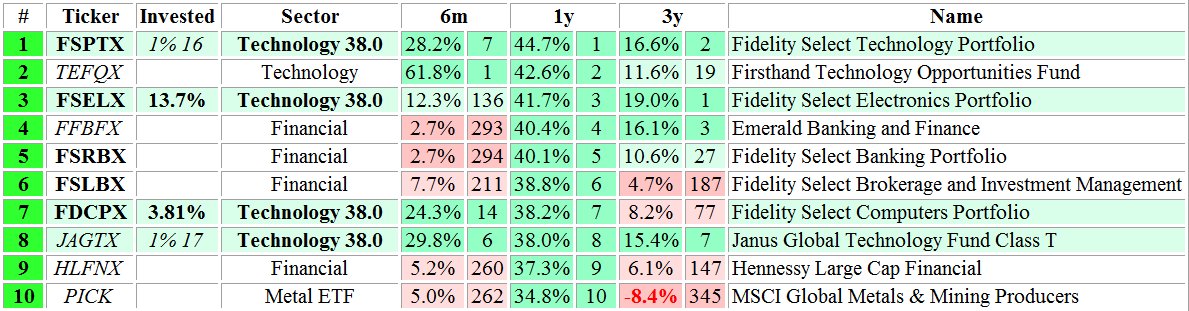
- The symbols are sorted on the Sum of the Ranks of multiple
rates of return at the same time!
- A new rank # is then assigned for the Custom View itself;
Best, 2nd best, 3rd, 4th, etc.
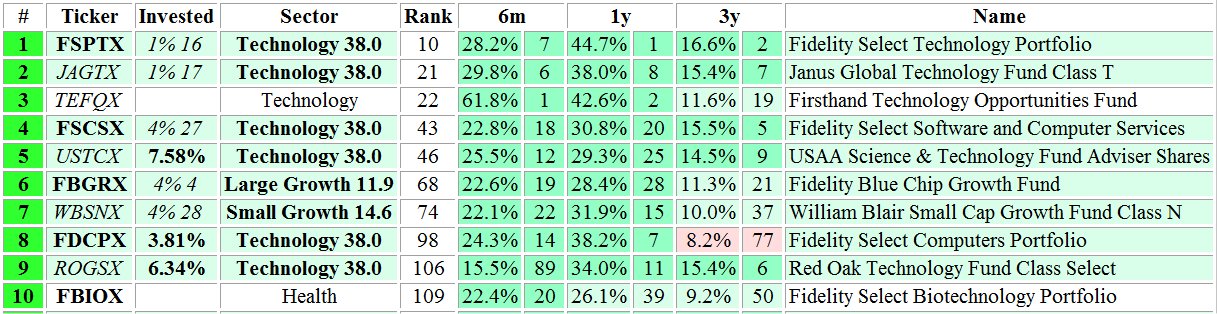
- Let's compare this multi-ROR view to the single ROR view on the previous page.
- Take away the rankings and the background colors, and this is the
way your broker gives you the list of what you might want to
invest in, sorted only on the 1 year ROR!
- The Market View software allows the end user can create multiple Custom Views
based on any combination of the 15 available rates of return calculated for each
SnapShot.
| Views | 1w | m1 |
m2 | m3 | q1 | m4 | m5 |
m6 | 6m | q2 | q3 | q4 |
1y | 3y | 5y |
| Years | | |
| | | |
| | 6m |
| | |
1y | 3y | |
| Long | | |
| | q1 |
| | |
6m | | |
| 1y | |
|
| Mid | | m1 |
| | q1 |
| | |
6m | | |
| | |
|
| Short | | m1 | m2 |
m3 | | m4 | |
| | |
| | |
| |
| Quick | 1w | m1 | m2 |
| | |
| | |
| | |
| | |
| Now | 1w | m1 | |
| | |
| | |
| | |
| | |
- Since the Rankings of the Custom Views are not based on the RORs
of the market indexes for any single timeframe:
- A new color scheme had to be created.
- The "Top End" break points for this new color scheme are
completely user definable.
| ROR Ranking | SWAG | Size | Half |
Display | Top End | Custom Rankings |
| Higher than highest |
36 | 36 | 18 | 18 |
18 | Best of the Best |
| 18 | 37 |
55 |
The good stuff |
| Higher than average |
74 | 38 | 19 |
| 19 | 45 |
100 |
Average stuff |
| Higher than lowest |
126 | 52 | 26 |
| 26 | 26 | 126 |
Not horrible |
| Lower than lowest | 214 |
88 | 88 | 88 | 214 |
The bad stuff |
- The colors in the left hand column are completely controlled by
the Market View software. When you sort your list of market symbols
on any single timeframe, on any single snapshot date:
- The 4 major market index RORs for that single timeframe, date,
and ROR are added together and divided by 4 to create the
average market ROR.
- If you set the Lines dropdown to all and scroll down the
display you will see the number of symbols that are displayed in
each ROR Ranking color.
- For my personal view, since I’m interested looking at my
investments a couple times a year, I looked at the 6 month and
1 year change points for a few months, then I took a Scientific
Wild ‘Arithmetic’ Guess, SWAG, at the top end
symbol counts for each ROR ranking.
- Then I perform any kind of calculations I wanted to determine the
Top End values to be used to display the multiple time frame
rankings.
- Like I said: The Top End break points are completely
user definable!
Long, Median, and Short Composite
Views of the Market
|
